自动发现
前面我们一起学习了如何在 Prometheus Operator 下面自定义一个监控项,以及自定义报警规则的使用。那么我们还能够直接使用前面课程中的自动发现功能吗?如果在我们的 Kubernetes 集群中有了很多的 Service/Pod,那么我们都需要一个一个的去建立一个对应的 ServiceMonitor 或 PodMonitor 对象来进行监控吗?这样岂不是又变得麻烦起来了?
自动发现配置
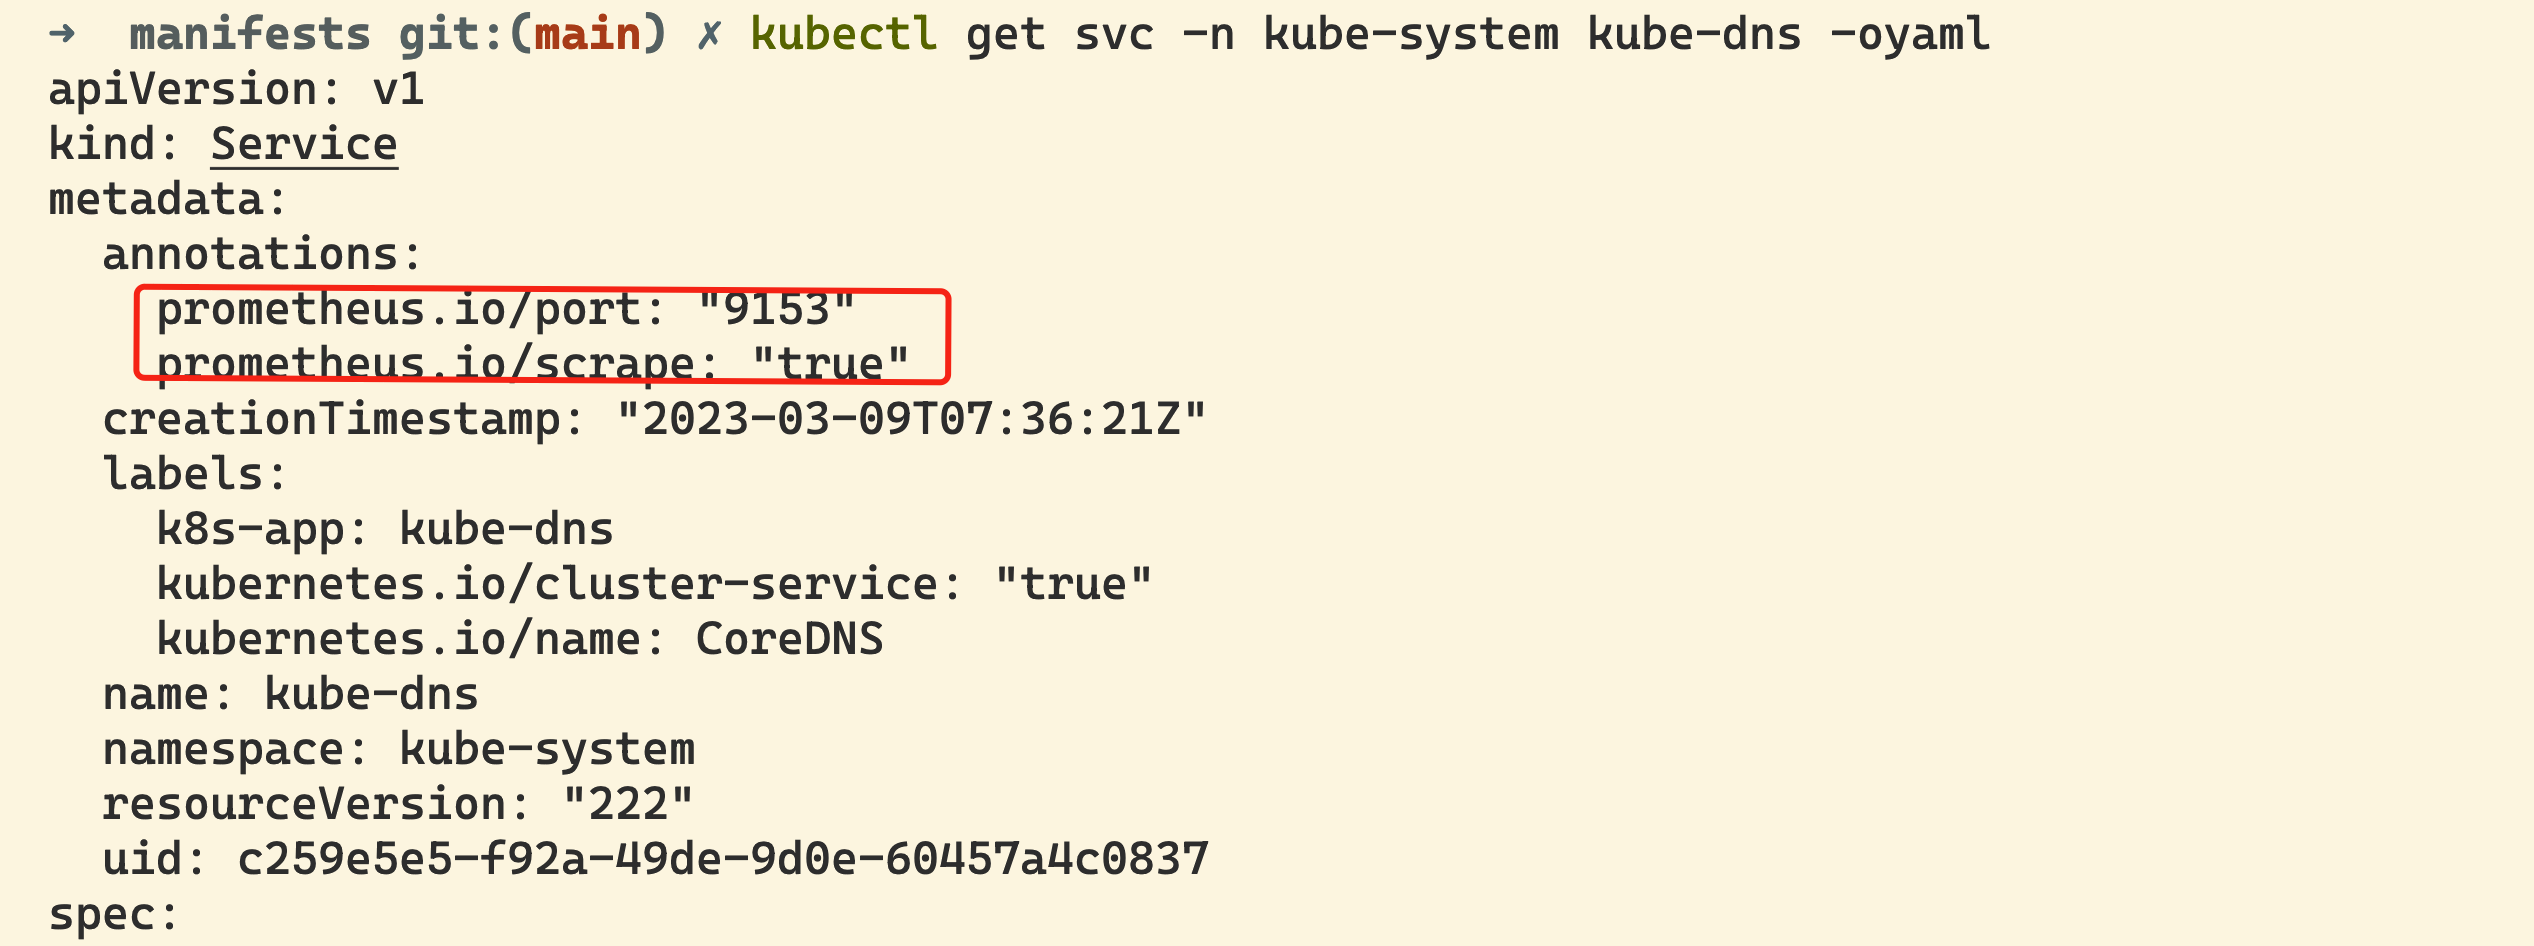
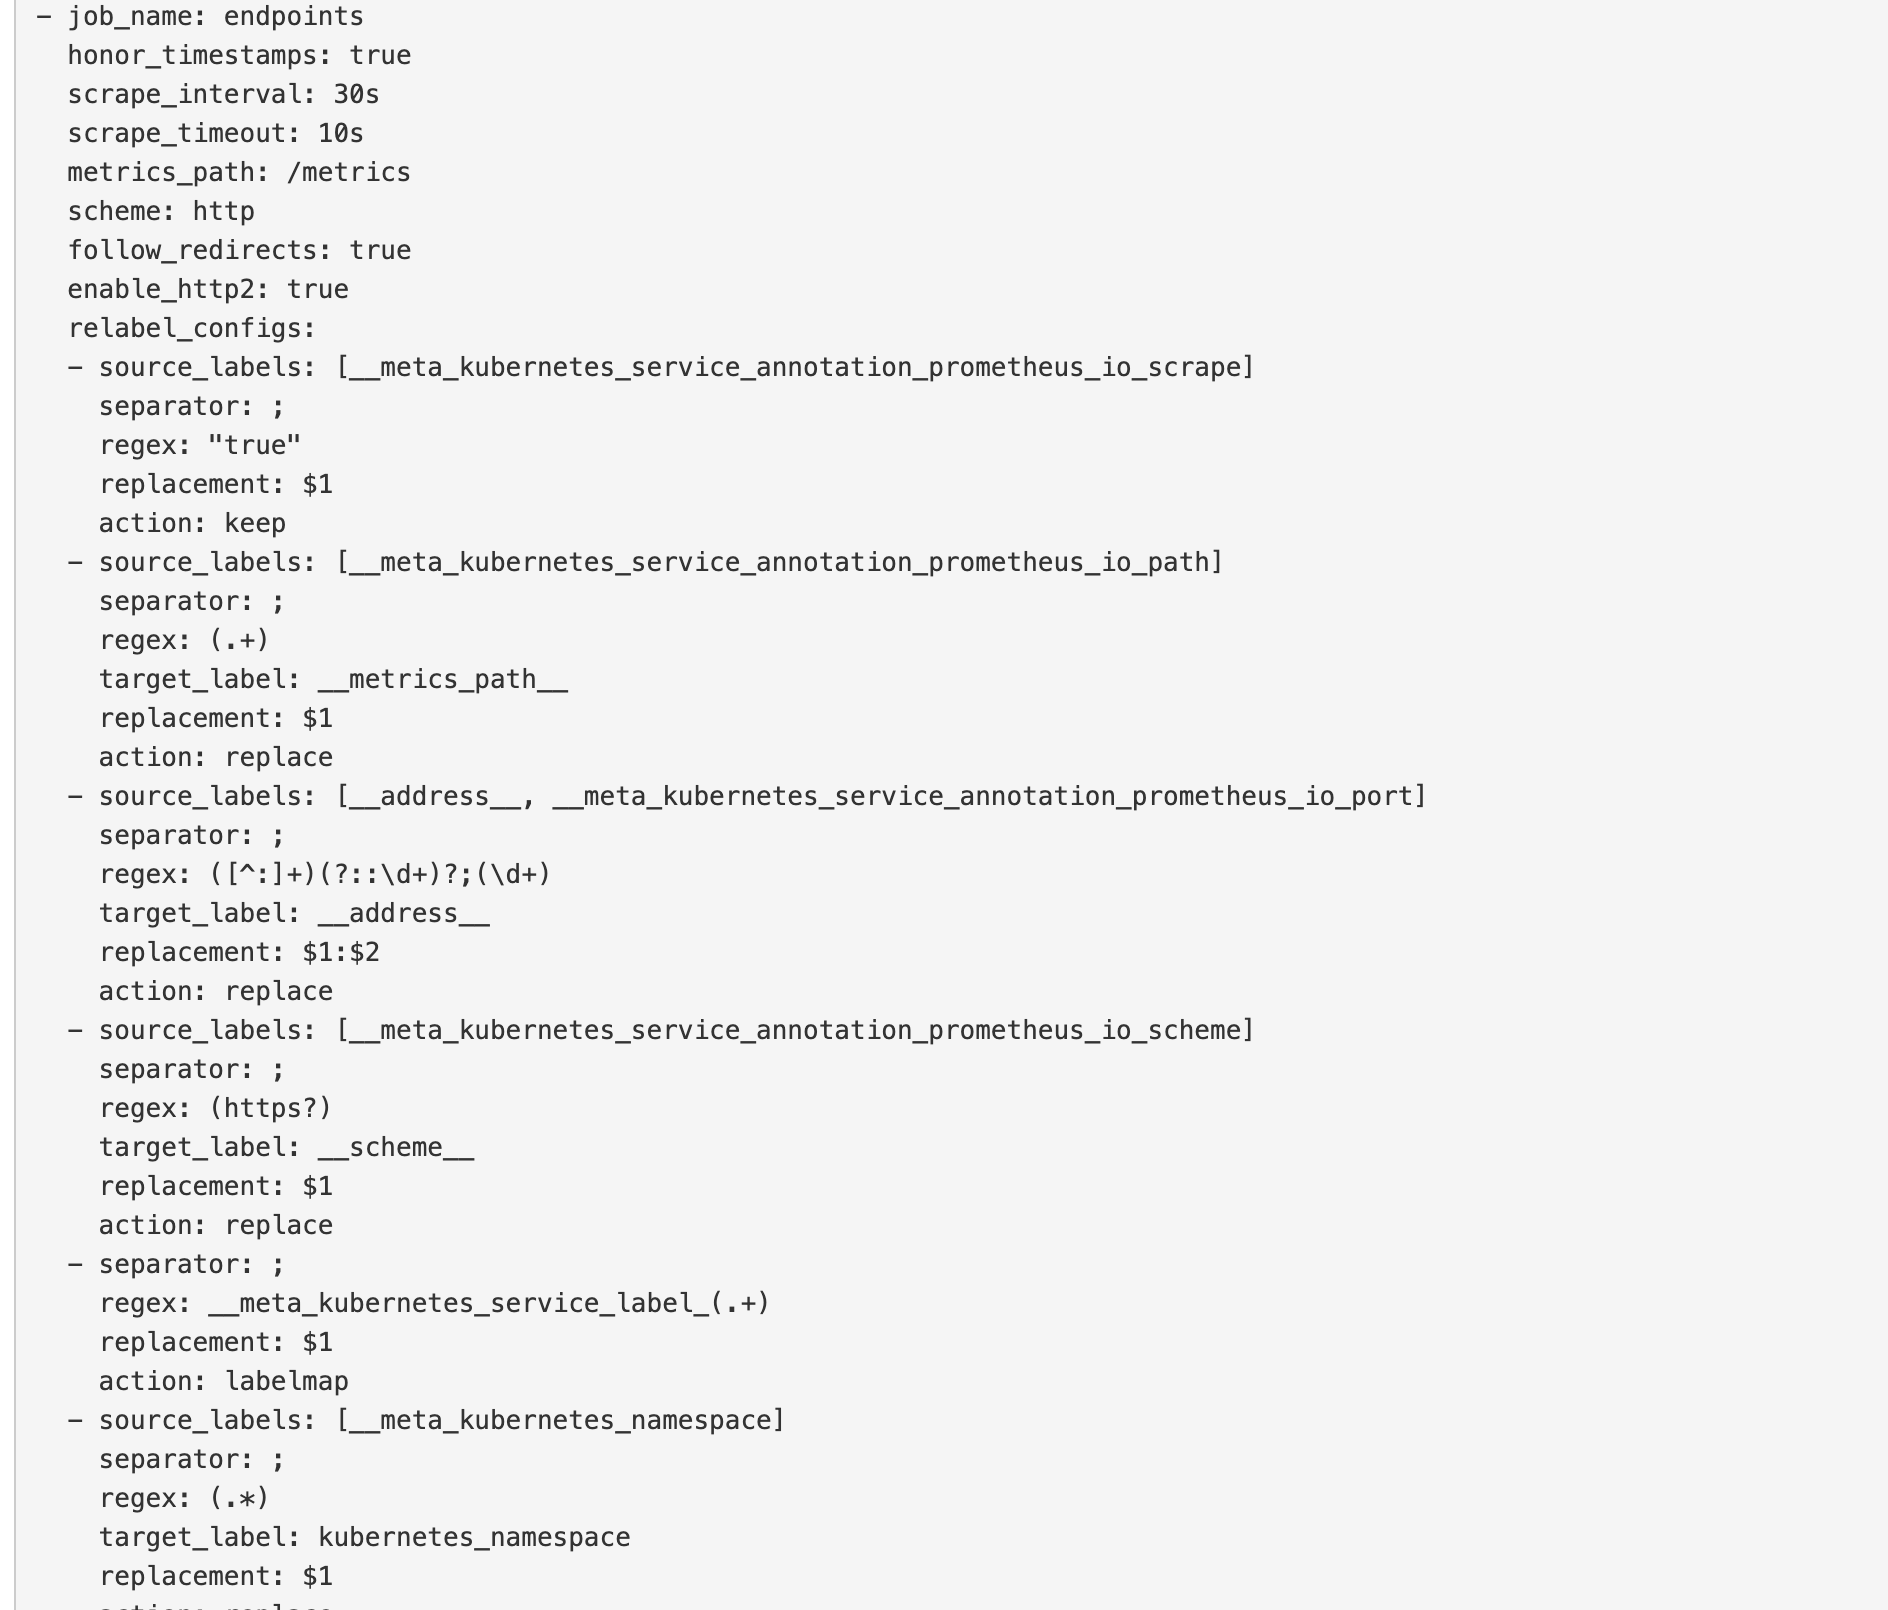
为解决上面的问题,Prometheus Operator 为我们提供了一个额外的抓取配置来解决这个问题,我们可以通过添加额外的配置来进行服务发现进行自动监控。和前面自定义的方式一样,我们可以在 Prometheus Operator 当中去自动发现并监控具有 prometheus.io/scrape=true 这个 annotations 的 Service,之前我们定义的 Prometheus 的配置如下:
- job_name: "endpoints"
  kubernetes_sd_configs:
    - role: endpoints
  relabel_configs: # 指标采集之前或采集过程中去重新配置
    - source_labels: [__meta_kubernetes_service_annotation_prometheus_io_scrape]
      action: keep # 保留具有 prometheus.io/scrape=true 这个注解的Service
      regex: true
    - source_labels: [__meta_kubernetes_service_annotation_prometheus_io_path]
      action: replace
      target_label: __metrics_path__
      regex: (.+)
    - source_labels:
        [__address__, __meta_kubernetes_service_annotation_prometheus_io_port]
      action: replace
      target_label: __address__
      regex: ([^:]+)(?::\d+)?;(\d+) # RE2 正则规则,+是一次多多次,?是0次或1次,其中?:表示非匹配组(意思就是不获取匹配结果)
      replacement: $1:$2
    - source_labels: [__meta_kubernetes_service_annotation_prometheus_io_scheme]
      action: replace
      target_label: __scheme__
      regex: (https?)
    - action: labelmap
      regex: __meta_kubernetes_service_label_(.+)
      replacement: $1
    - source_labels: [__meta_kubernetes_namespace]
      action: replace
      target_label: kubernetes_namespace
    - source_labels: [__meta_kubernetes_service_name]
      action: replace
      target_label: kubernetes_service
    - source_labels: [__meta_kubernetes_pod_name]
      action: replace
      target_label: kubernetes_pod
    - source_labels: [__meta_kubernetes_node_name]
      action: replace
      target_label: kubernetes_node
如果你对上面这个配置还不是很熟悉的话,建议去查看下前面关于 Kubernetes 常用资源对象监控章节的介绍,要想自动发现集群中的 Service,就需要我们在 Service 的 annotation 区域添加 prometheus.io/scrape=true 的声明,将上面文件直接保存为 prometheus-additional.yaml,然后通过这个文件创建一个对应的 Secret 对象:
$ kubectl create secret generic additional-configs --from-file=prometheus-additional.yaml -n monitoring
secret "additional-configs" created
然后我们需要在声明 prometheus 的资源对象文件中通过 additionalScrapeConfigs 属性添加上这个额外的配置:
# prometheus-prometheus.yaml
apiVersion: monitoring.coreos.com/v1
kind: Prometheus
metadata:
  name: k8s
  namespace: monitoring
spec:
  # ...... 省略其他
  additionalScrapeConfigs:
    name: additional-configs
    key: prometheus-additional.yaml
关于 additionalScrapeConfigs 属性的具体介绍,我们可以使用 kubectl explain 命令来了解详细信息:
$ kubectl explain prometheus.spec.additionalScrapeConfigs
KIND:     Prometheus
VERSION:  monitoring.coreos.com/v1

RESOURCE: additionalScrapeConfigs <Object>

DESCRIPTION:
     AdditionalScrapeConfigs allows specifying a key of a Secret containing
     additional Prometheus scrape configurations. Scrape configurations
     specified are appended to the configurations generated by the Prometheus
     Operator. Job configurations specified must have the form as specified in
     the official Prometheus documentation:
     https://prometheus.io/docs/prometheus/latest/configuration/configuration/#scrape_config.
     As scrape configs are appended, the user is responsible to make sure it is
     valid. Note that using this feature may expose the possibility to break
     upgrades of Prometheus. It is advised to review Prometheus release notes to
     ensure that no incompatible scrape configs are going to break Prometheus
     after the upgrade.

FIELDS:
   key  <string> -required-
     The key of the secret to select from. Must be a valid secret key.

   name <string>
     Name of the referent. More info:
     https://kubernetes.io/docs/concepts/overview/working-with-objects/names/#names
     TODO: Add other useful fields. apiVersion, kind, uid?

   optional     <boolean>
     Specify whether the Secret or its key must be defined
添加完成后,直接更新 prometheus 这个 CRD 资源对象即可:
$ kubectl apply -f prometheus-prometheus.yaml
prometheus.monitoring.coreos.com "k8s" configured
隔一小会儿,可以前往 Prometheus 的 Dashboard 中查看配置已经生效了:
但是我们切换到 targets 页面下面却并没有发现对应的监控任务,查看 Prometheus 的 Pod 日志:
$ kubectl logs -f prometheus-k8s-0 prometheus -n monitoring
......
ts=2022-05-26T09:34:30.845Z caller=klog.go:108 level=warn component=k8s_client_runtime func=Warningf msg="pkg/mod/k8s.io/client-go@v0.23.5/tools/cache/reflector.go:167: failed to list *v1.Service: services is forbidden: User \"system:serviceaccount:monitoring:prometheus-k8s\" cannot list resource \"services\" in API group \"\" at the cluster scope"
ts=2022-05-26T09:34:30.845Z caller=klog.go:116 level=error component=k8s_client_runtime func=ErrorDepth msg="pkg/mod/k8s.io/client-go@v0.23.5/tools/cache/reflector.go:167: Failed to watch *v1.Service: failed to list *v1.Service: services is forbidden: User \"system:serviceaccount:monitoring:prometheus-k8s\" cannot list resource \"services\" in API group \"\" at the cluster scope"
ts=2022-05-26T09:34:40.552Z caller=klog.go:108 level=warn component=k8s_client_runtime func=Warningf msg="pkg/mod/k8s.io/client-go@v0.23.5/tools/cache/reflector.go:167: failed to list *v1.Pod: pods is forbidden: User \"system:serviceaccount:monitoring:prometheus-k8s\" cannot list resource \"pods\" in API group \"\" at the cluster scope"
ts=2022-05-26T09:34:40.552Z caller=klog.go:116 level=error component=k8s_client_runtime func=ErrorDepth msg="pkg/mod/k8s.io/client-go@v0.23.5/tools/cache/reflector.go:167: Failed to watch *v1.Pod: failed to list *v1.Pod: pods is forbidden: User \"system:serviceaccount:monitoring:prometheus-k8s\" cannot list resource \"pods\" in API group \"\" at the cluster scope"
可以看到有很多错误日志出现,都是 xxx is forbidden,这说明是 RBAC 权限的问题,通过 prometheus 资源对象的配置可以知道 Prometheus 绑定了一个名为 prometheus-k8s 的 ServiceAccount 对象,而这个对象绑定的是一个名为 prometheus-k8s 的 ClusterRole:
# prometheus-clusterRole.yaml
apiVersion: rbac.authorization.k8s.io/v1
kind: ClusterRole
metadata:
  name: prometheus-k8s
rules:
  - apiGroups:
      - ""
    resources:
      - nodes/metrics
    verbs:
      - get
  - nonResourceURLs:
      - /metrics
    verbs:
      - get
上面的权限规则中我们可以看到明显没有对 Service 或者 Pod 的 list 权限,所以报错了,要解决这个问题,我们只需要添加上需要的权限即可:
apiVersion: rbac.authorization.k8s.io/v1
kind: ClusterRole
metadata:
  name: prometheus-k8s
rules:
  - apiGroups:
      - ""
    resources:
      - nodes
      - services
      - endpoints
      - pods
      - nodes/proxy
    verbs:
      - get
      - list
      - watch
  - apiGroups:
      - ""
    resources:
      - configmaps
      - nodes/metrics
    verbs:
      - get
  - nonResourceURLs:
      - /metrics
    verbs:
      - get
更新上面的 ClusterRole 这个资源对象,然后重建下 Prometheus 的所有 Pod,正常就可以看到 targets 页面下面有 endpoints 这个监控任务了:
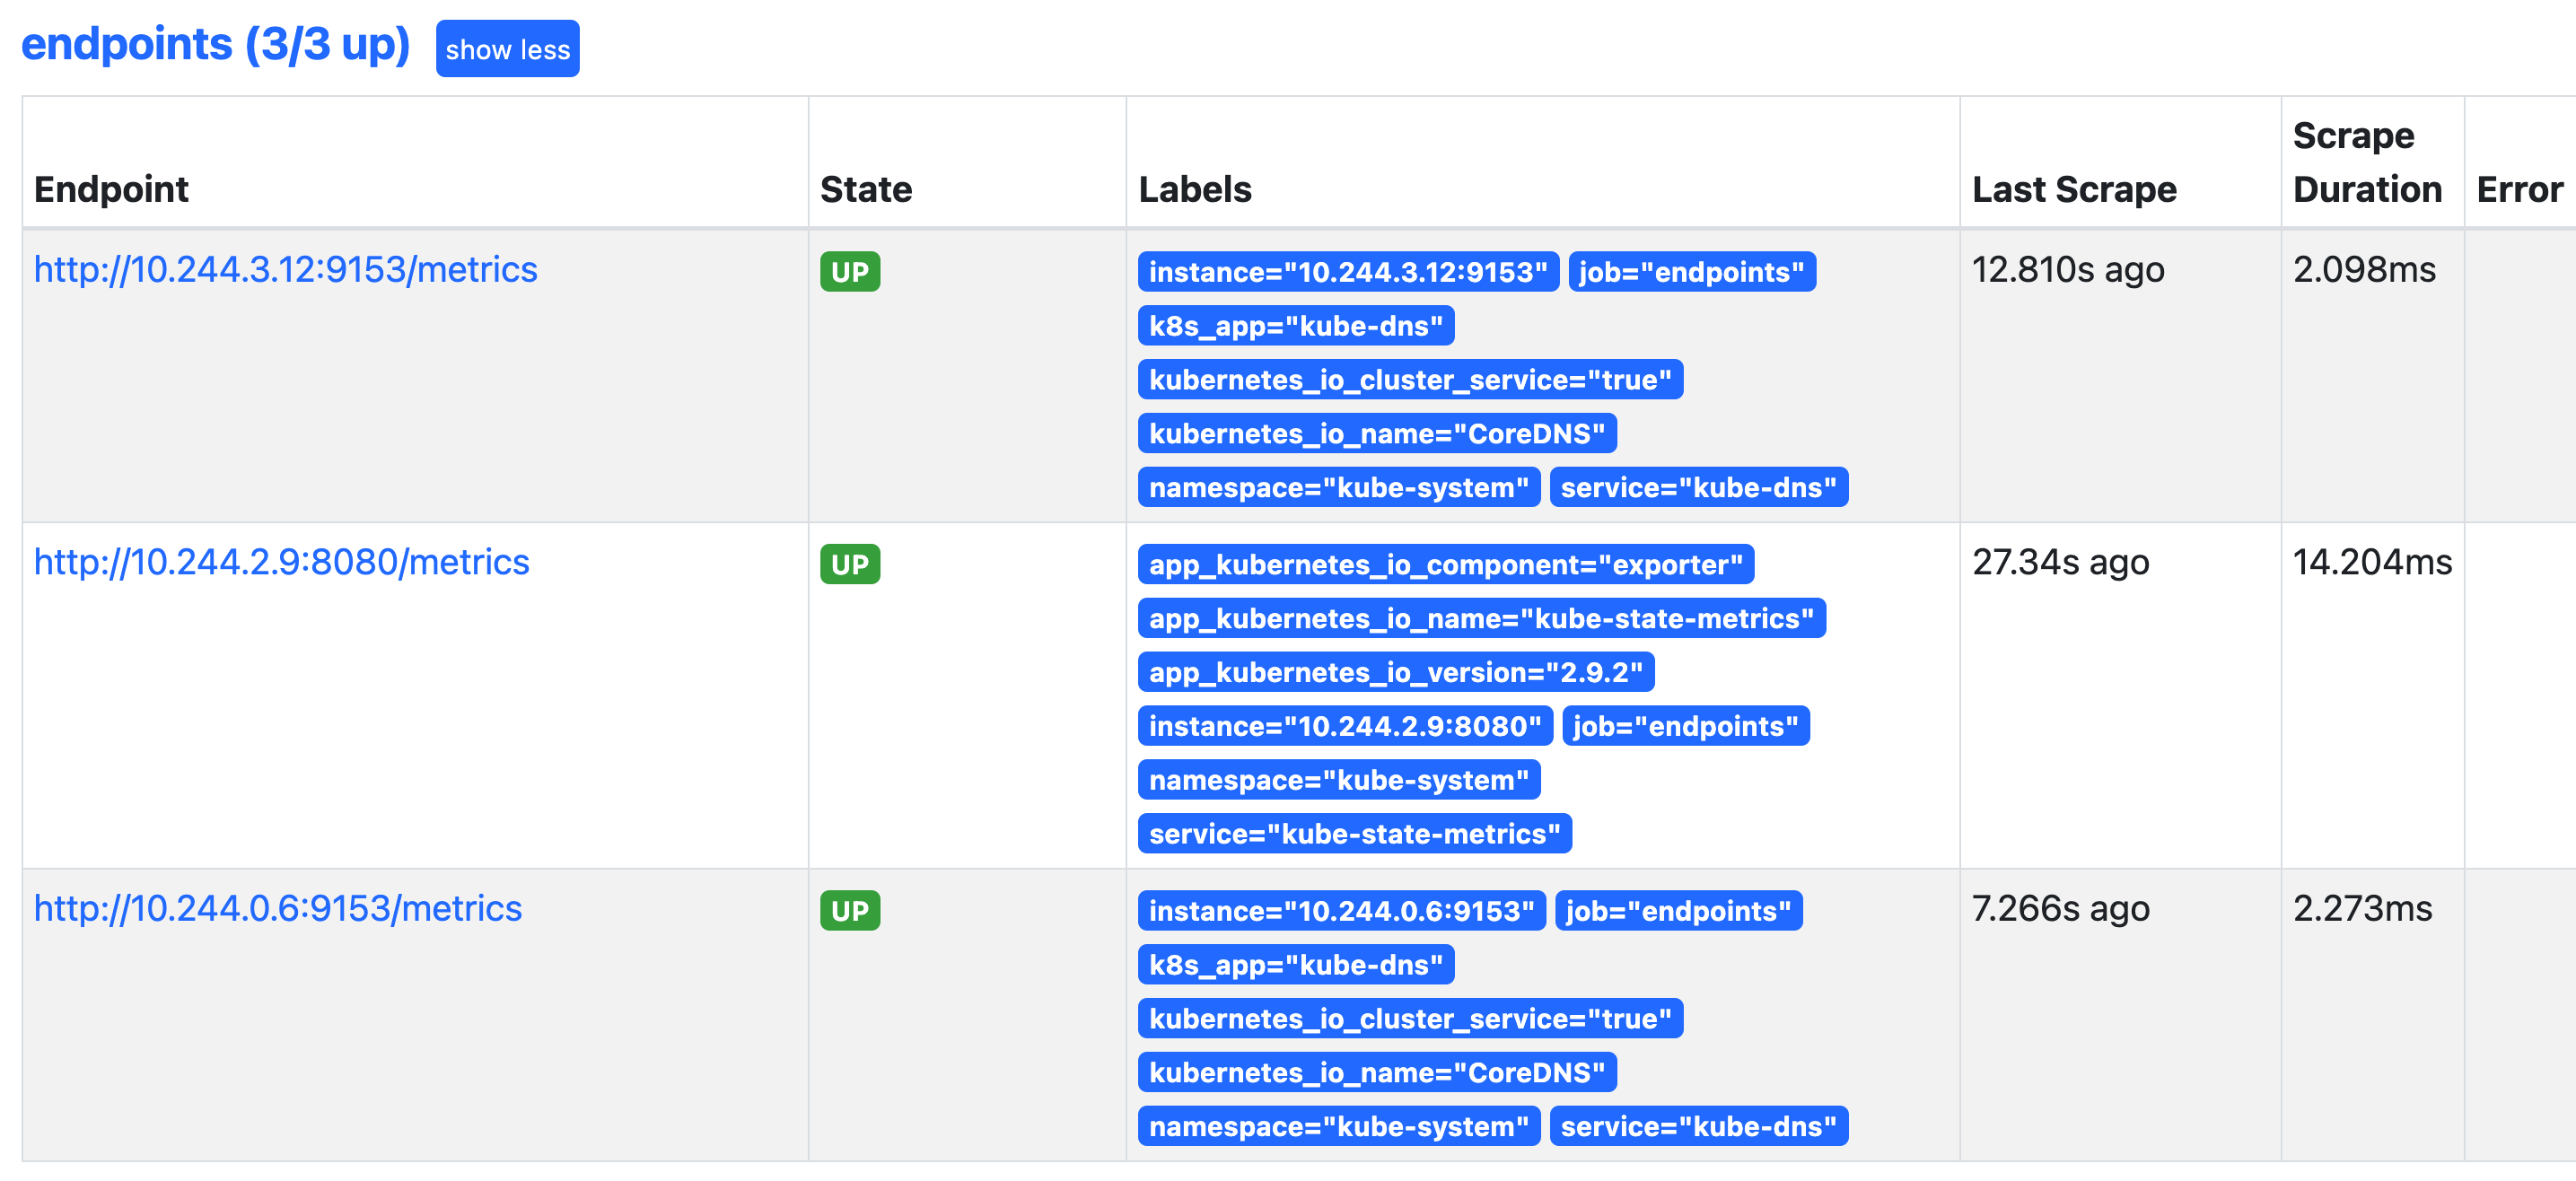
这里发现的几个抓取目标是因为 Service 中都有 prometheus.io/scrape=true 这个 annotation。